Measure twice cut once
On the one hand, it is much easier to improve the human resources management in organizations today than it was 15 years ago. We are surrounded by an infinite information space. Knowledge can be derived from books, specialized business publications and the Internet...
On the other hand, it is sometimes easier to sink in this information ocean than to swim to the destination. Do you remember the hero of Jerome K. Jerome "Three Men in a Boat", who read a medical reference book and decided that he had all the symptoms of diseases, except puerperal fever? Similar things happen with company's management. Having read a popular magazine on management, one wants to start immediately improving the corporate culture, implementing the project of team building and the motivation system, etc, etc, etc.
QUESTIONNAIRE SURVEYS OF STAFF WORK SATISFACTION
In order to determine the priority of this or that consulting project, it is necessary to diagnose the personnel management system. One way is to conduct the questionnaire of staff satisfaction with their work. The objectives of this research are as follows:
- to identify the inefficiency zones in a company;
- to identify the opportunities of improving its productivity, efficiency, employees’ loyalty
To get the relevant information on research results, representatives of all the departments, gender and age groups, administrative levels of the Đompany should take part. The questionnaire poll is desirable to be anonymous. In this case, the number of respondents' sincere and reliable answers is increased.
Comparing the results of statistical processing profiles (distribution of answers by respondents’ groups) allows revealing both the relative prosperity- and high-risk areas in personnel management.
The EXAMPLE OF STAFF QUESTIONING AT A COMPANY is presented in Table below. The values "at risk" are highlighted in red; yellow is a group of relative disadvantage, blue is the prosperous zone. Prior to the questioning, the Company’s management formulated personnel’s excessive loading and excessive tension as their major problem. However, the carried out research showed (see the distribution of problematic zones in the analyzed aspects) that most of all the Company’s personnel was not satisfied with their amount of wages and lack of labor remuneration/performance correlation. As for their mode of operation and its strength, almost everyone was satisfied.
Questionnaire poll statistical results (distribution of responses over the respondents’ groups)
|
Analyzed aspect |
Mean value at Company |
Structural Department ╣ |
|||||||||
|
1 |
2 |
3 |
4 |
6 |
7 |
8 |
9 |
10 |
11 |
||
|
1. Size of salary |
-0,11 |
-0,29 |
0,06 |
-0,14 |
-0,63 |
-0,06 |
-0,21 |
0,00 |
0,00 |
0,00 |
0,33 |
|
2. Mode of operation |
0,50 |
0,43 |
0,19 |
0,29 |
0,00 |
0,64 |
0,47 |
0,39 |
0,29 |
0,69 |
0,74 |
|
3. Job enrichment (routine absence) |
0,52 |
0,67 |
0,70 |
0,63 |
0,58 |
0,77 |
0,45 |
0,58 |
-0,50 |
0,64 |
0,65 |
|
5. Strength of work |
0,25 |
0,36 |
0,64 |
0,50 |
-0,17 |
0,36 |
0,02 |
0,54 |
0,00 |
0,36 |
0,74 |
|
8. Career advancement |
0,10 |
-0,38 |
-0,40 |
0,40 |
-0,25 |
0,21 |
0,08 |
-0,06 |
0,33 |
-0,25 |
0,69 |
|
12. Labor remuneration/performance correlation |
-0,08 |
0,20 |
0,07 |
-0,13 |
-1,00 |
0,17 |
-0,29 |
-0,19 |
0,50 |
-0,50 |
0,58 |
|
13. Possibility to upgrade (professional) skills |
0,43 |
0,44 |
0,31 |
0,44 |
0,17 |
0,29 |
0,41 |
0,42 |
-0,07 |
0,25 |
0,85 |
Conclusions on staff questioning results
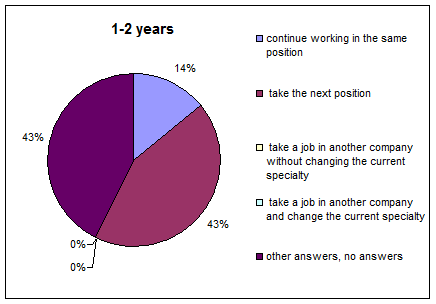
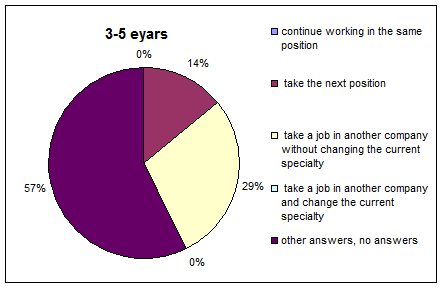
No objective picture of the state of affairs at the Customer’s Company can be seen analyzing the separate responses. It is necessary to compare the answers to various questions. For example, according to the analysis of tabular data in Department 4, the staff is dissatisfied with labor remuneration and hard work, combined with rather low rate in the parameter "Career". It could mean the Company’s insufficient attractiveness as an employer for the specialists of that structural department/specialization. This hypothesis was confirmed by responses to the other question concerning the staff future plans (See: Charts 1 and 2 below). Thus, the analysis results show that only 14 percent of the staff in Department 4 is planning to continue working at previous job position for 1-2 years. This parameter is 4 times lower than the Company’s average data. Not a single employee of Department 4 is planning to continue working in the same job position for the next 3-5 years. At the same time, 29 percent of the Department employees are planning to start working for another Company in the next 3-5 years. This parameter is 4 times higher than the Company’s average data. As the Company’s key competence is concentrated in Department 4, the current situation requires immediate interference and salvation.
| Chart 1 | Chart 2 |
| Plans of Department employees for 1-2 years | Plans of Department employees for 3-5 years |
 |
|
The questioning results allow getting a "dry residue" on the answers to the following rhetorical questions:
- What is more important for your staff: recognition of their merits or money?
- What is a motivating factor for your staff: whip or carrot?
- Does the staff work fully in 110 percent or just imitate their activity?
- Are they going to work for the company until their retirement, or is it necessary to train a staff reserve?
Diagnosis of the personnel management system allows revealing the true state and priorities (project preferences) in improving the human resource management of the Company. In turn, it will help improve the manageability of the most unpredictable factor, namely, the human factor.
P.S. By the way, the character of Jerome K. Jerome visited the doctor at last. After examination, the doctor proscribed him the following recipe. It ran:
«1 lb. beefsteak, with 1 pt. bitter beer every 6 hours
1 ten-mile walk every morning
1 bed at 11 sharp every night
And don’t stuff up your head with things you don’t understand …».
Do not forget to ask advice of a consulting company before starting making considerable changes in your Company’s activity.
We would be glad to render all the necessary assistance.

 Events and Opinions


